Anti-Semitism and Other Bias Crimes in America: 2004-2011 Comparisons

 In its March 2011 Occasional Paper entitled, “Religious Bias Crimes 2000-2009: Muslim, Jewish and Christian Victims – Debunking the Myth of a Growing Trend in Muslim Victimization,”[1] the Center for Security Policy (CSP) used official annual data published by the Federal Bureau of Investigation (FBI) to debunk the common fallacy spread by “Islamophobia” proponents that Muslims have been the target of an increasing wave of “hate crimes” in the years following the attacks of 11 September 2001. In fact, as the FBI data show, the number of religious bias crimes (or “hate crimes”) against Muslims post-9/11 is actually significantly lower than such crimes against Jews.[2]
From 2000 through 2009, the Center found that, according to the FBI statistics,[3] Jewish victims of hate crimes outnumbered Muslim victims by about six to one. Subsequent FBI statistics for 2010[4] and 2011[5] show a ratio of Jewish to Muslim victims of about five to one. The study’s presentation of hard data on such “religious bias crimes” (only reinforced by the additional data from the two more recent years) exposed the political agenda of certain highly vocal Muslim lobbying groups, many linked to the Muslim Brotherhood and leftwing activists, which persist in promoting the false narrative of America’s alleged “Islamophobia.” In fact, there is no “rising trend” in hate crimes against Muslim Americans and allegations to the contrary are demonstrably counterfactual as well as “corrosive to community relationships at every level of American society, and a potential threat to national security,”[6] as Center for Security Policy President Frank Gaffney pointed out.
With that 2011 study as a baseline, the Center for Security Policy expanded the earlier analysis for a second phase of analysis, described below.
Methodology
This second phase of the study has two components:
First, the Center created an online database, with over 17,365 reports for localities showing hate crimes from 2004-2011, as well as 44 reports for US nationwide reports and 5 comprehensive nationwide reports for each broad category of victim groups (bias groups), also from 2004-2011. The Center has put this database into the public domain in order to provide longitudinal data showing trends to all groups representing historical or potential victim categories, as well as to all localities from the federal to state to city or even university reporting agency level. Only when the public can see the actual data – and trends – in hate crimes for a significant period of time, in this case from 2004-2011, can they assess the seriousness of the problem and the context to develop policies, if needed, to address it. The categories of reports in the online database include:
- 44 Comprehensive Reports: US nationwide data from 2004 – 2011 for incidents, offenses, victims, and known offenders;
- 5 Comprehensive Reports: US nationwide data for individual bias victim groups, across all types of offenses, from 2004-2011;
- 17,365 Summary Reports: Locality information for all states, cities, universities, county law enforcement agencies, tribal law enforcement agencies and other entities such as railroads that report hate crimes using the Uniform Crime Reporting protocol to the FBI, from 2004-2011, compared in each local report two other tables: the state’s total for bias categories and agency types. These localities’ data are provided by the FBI at a summary level (religion, race), not at the detailed level of bias crimes against specific religions (anti-Jewish, anti-Catholic) or specific races (anti-Black, anti-White).
The second component of this analysis is provided in this report, with a selection of graphs showing the findings presented in the online database. All comparisons were based on the data provided by the FBI Uniform Crime Reporting data for hate crimes from 2004-2011.
Caveats
Any report on hate crime trends must also include first, a caveat that every victim group is reported by that group’s advocates and experts to under-report, for a range of reasons. Second, the analyst must keep in mind that the workflow and bureaucratic process for local police agencies to identify a hate crime, verify the status of the crime with superior officers, and complete the complex UCR form to report it to the FBI have well-known institutional weaknesses that have been identified in over two decades of critical studies from scholars across the political spectrum. A final caveat on any study about hate crimes is the simple statistical common sense that, in a population of over 300 million citizens and legal residents, and an additional 10-30 million illegal residents, the numbers reported for hate crimes in all categories are very small and changes in trends can appear to be significant at a percentage basis precisely because of the small baseline numbers.
Nonetheless, comparisons between groups, especially the continued high rate of anti-Jewish crimes both against persons and property, are important for providing insight into public attitudes and guiding law enforcement and public information policy.
Broader questions of the legal status of hate crimes per se will be addressed in a separate paper. Phase 3 of the study will be published in December 2013, addressing statistical and methodological comparisons of anti-Semitism as reported in the United States and Europe.
Findings
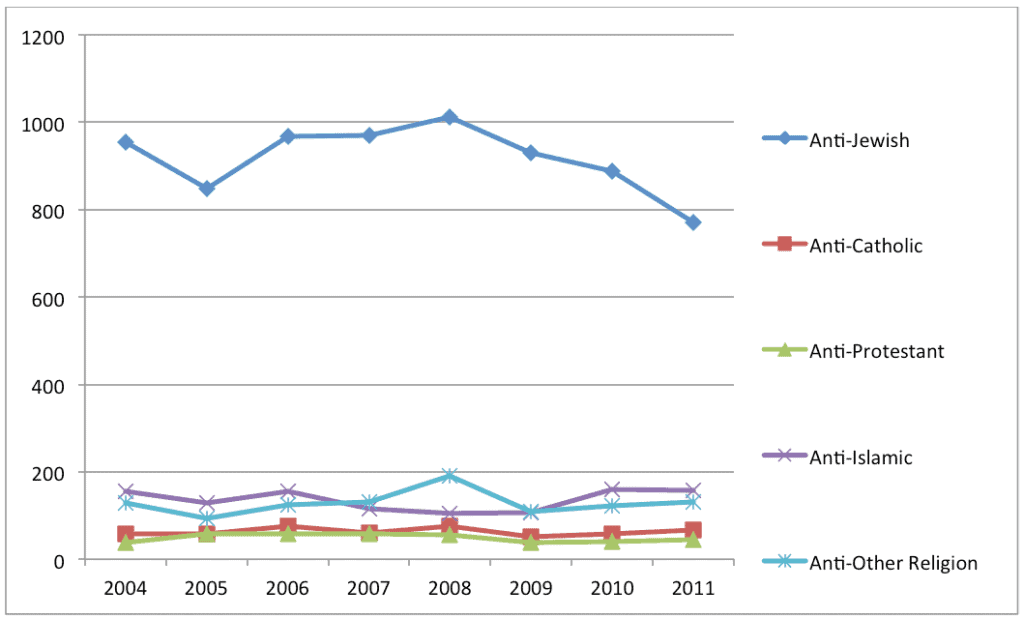
The broad trend in anti-Jewish (anti-Semitic) crimes from 2004 -2011 has been a downward trend, showing a reduction of 183 reported incidents between 2004 and 2011, and a reduction of 116 incidents between 2010 and 2011. Other religious groups report hate crimes at a greatly lower number, typically at 1/8 to 1/6 the number of incidents reported for anti-Jewish incidents. Other religious groups do not demonstrate the same reduction shown in anti-Jewish incidents.
Bias Crime Comparisons of Religious Groups: 2004-2011
Bias Crime Comparisons of Anti-Jewish Bias Category and All Anti-Ethnic/Anti-Race Categories: 2004-2011
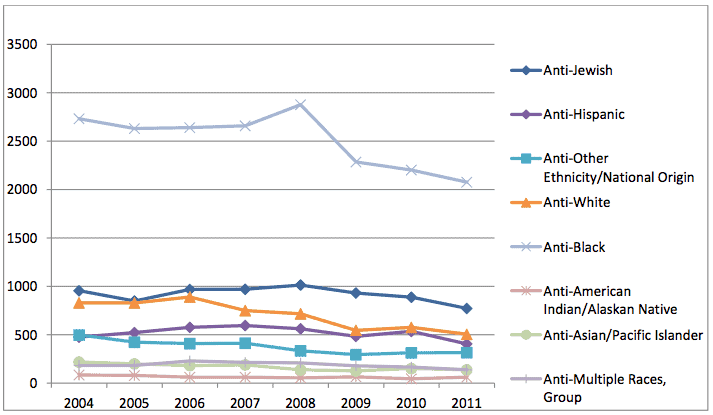
Anti-Black hate crimes were reported at approximately 2 to 2.5 times the rate of anti-Jewish hate crimes, in raw numbers. However, in relative numbers to total population, anti-Jewish hate crimes were significantly higher. According to 2012 estimated census data, the US black population was 13.1% of total US population (41,134,000) and Jewish population was 1.8% of total US population (5,652,000). As a percentage of population, anti-Jewish crimes occur at a rate of over 2.7 times the rate of anti-Black crimes.
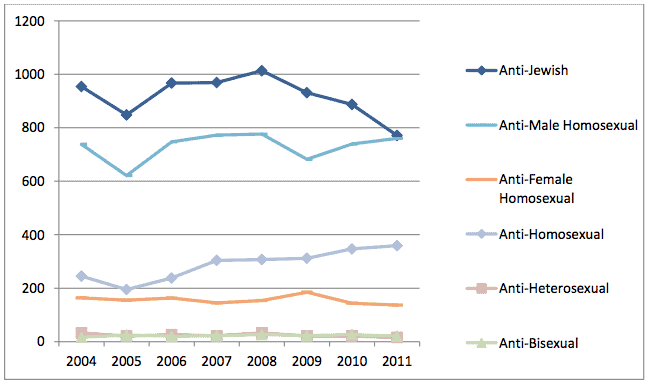
Anti-Homosexual hate crimes are also reported at high rates in terms of raw numbers. Due to the falling anti-Jewish hate crime rates, and rising anti-male homosexual rates, those numbers converged in 2011:
Bias Crime Comparisons of Anti-Jewish Bias Category and All Anti-Homosexual Categories: 2004-2011
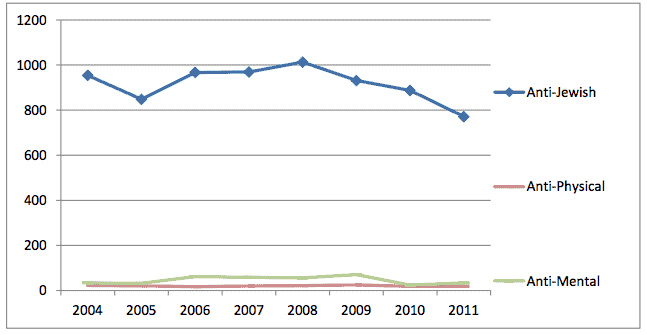
The remaining category of anti-Disability hate crimes is reported at very low levels:
Bias Crime Comparisons of Anti-Jewish Bias Category and All Anti-Disability Categories: 2004-2011
Conclusions
As a percentage of their population cohort, anti-Jewish bias crimes were reported at 6 to 8 times higher rates, from 2004-2011, than other religious group bias crimes. Anti-Jewish bias crimes are reported at over 2.5 times the rate of reporting for anti-black crimes. Trends for all victim groups have tended downwards or stayed at roughly the same level from 2004-2011, reflecting reduced crime rates in general.
Download ‘Anti-Semitism and Other Bias Crimes in America: 2004-2011 Comparisons’ as PDF
[1] “Religious Bias Crimes 2000-2009: Muslim, Christian, and Jewish Victims. Debunking the Myth of a Growing Trend in Muslim Victimization,” Center for Security Policy, /upload/wysiwyg/center%20publication%20pdfs/Center_for_Security_Policy_Religious_Bias_Crimes_0329.pdf
[2] “New Study on Hate Crimes Debunks the Myth of a Growing Trend in Muslim Victimization,” Center for Security Studies, March 29, 2011. Online at /2011/03/29/new-study-on-hate-crimes-debunks-the-myth-of-a-growing-trend-in-muslim-victimization-8/
[3] FBI Hate Crimes website is online at https://www.fbi.gov/about-us/investigate/civilrights/hate_crimes
[4] FBI Hate Crime Statistics 2010, Victims by Religious Bias. Online at https://www.fbi.gov/about-us/cjis/ucr/hate-crime/2010/narratives/hate-crime-2010-victims
[5] FBI Hate Crime Statistics 2011, Victims by Religious Bias. Online at https://www.fbi.gov/about-us/cjis/ucr/hate-crime/2011/narratives/victims
[6] “New Study on Hate Crimes Debunks the Myth of a Growing Trend in Muslim Victimization”
- Military Starship: How SpaceX Is About to Make America Globally Dominant - March 4, 2025
- The Cautionary Tale of Zheng He - December 4, 2024
- Frank Gaffney departs CSP after 36 years - September 27, 2024